life with type 1 diabetes

Month: February 2015

and the science project continues…

DualBloodSugarOverTime

Creating dashboards to answer questions — my question is how am I doing now, as opposed to then? and I want to be able to change both of those time frames… comparing this week to last year, this week to last week, this month to last month, to the last three months… and so I created this dashboard. Above is just an image, I’ve started using a bit more technical solutions, so I’m going to be posting image files for a bit until I get a better process in place to use the publicly available/postable versions again.

[Data Dork Stuff] I figured out that the export file I was creating was cutting off at 65,536… does that number ring a bell? Yup, that’s right — the export file was .xls and not .xlsx — I can’t believe that I missed that #dorkfail — so this explained why my data was cutting off in December, in order to resolve this issue I had to export the data from the data blending tool into a Tableau Extract rather than and Excel file, since .xlsx isn’t an export option (#softwarefail #upgraderequest). Building visualizations from a Tableau extract requires using Tableau Desktop, rather than Tableau Public — like I said, I’m working on finding a way back onto public with this data, so that the dynamic versions can be shared here… and elsewhere without the need to use the desktop software. [Other tools] Looking at bringing together data from my OmniPod and my Dexcom — I used Diasense to get a sense (womp womp) for what I’m bringing together. I love their idea, and the tool — but I hate the interface. Okay, hate is a strong word (and I did just say I love the tool <3), but I love data, and I know that it can be displayed in a way that not only looks better, but is more conducive to helping diabetics understand their own bodies and support actionable decisions in their/my daily life. Next Steps… OmniPod data…

In other news, I’m really struggling staying on a diabetic diet — I eat breakfast, I snack smart, I get all the way to the evening and then I get a case of the fuck-its, except while still hearing reason in my head… it’s maddening. Hoping look at all this data will help me see what I need to see clearly… and help me to make the right decisions, or at least the right next step.
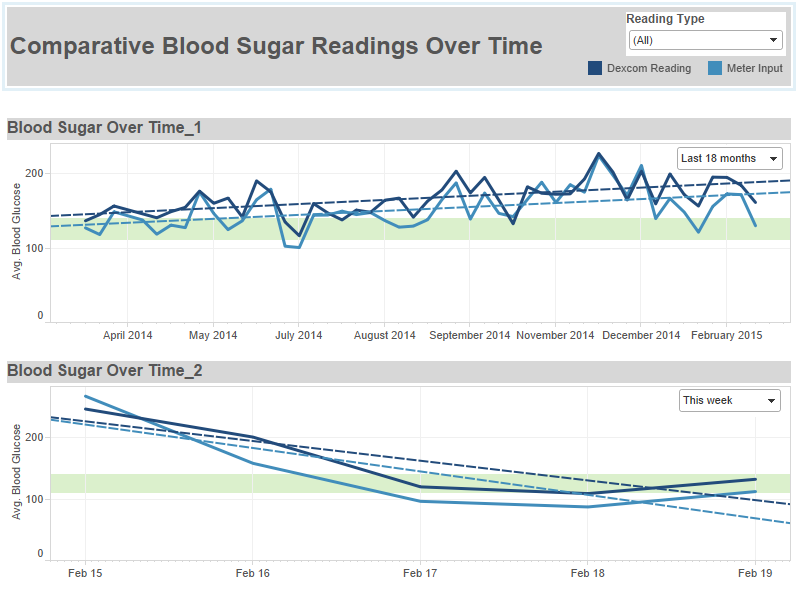
Diabetic Dashboard

People ask “How are you doing?” all the time, usually I answer with “fine”… well here’s a more comprehensive and Illustrative answer…


This is my latest take on something that could help me to better understand my diabetes and how to manage it. For right now I’m really just reporting findings, but as I get a better sense as to what I can pull out of my devices, I will switch gears into focusing on insights that I can pull out of the information.

Let me start by saying that I used professional tools to get to this point — I could have stuck to excel, but it would have taken me a lot longer and wouldn’t have been a repeatable process. My goal is to hone this process, so I can get as close to real time as possible — based on the level of effort required, I think that the most practical estimate for this is probably a weekly report, but the process is going to need work to even get to that point.

How did I get here? [the geeky stuff] Dexcom reports out two sets of numbers — the meter values that you input to the receiver (calibrating it), and the reported values that show on the screen every five minutes, these two sets of data are reported separately, but in the same worksheet. To add to this, when I updated the software on my Dexcom receiver it archived my file to date and created a new file, so I have to files one from when I started with the Dexcom to the software update, and then one from the software update to present day. What I needed to do was split and clean two data files, and then add together the corresponding parts, from there, I added an additional field identifying each of the data points as either being a “Meter Value” or a “Dexcom Reading” — which then enabled me to join the two tables back together as a single table with the fields of Time, Blood Glucose, and Type. This is the data set that I pulled into TableauPublic to build the visualization below. There were around 65k records, so we have a good bit of time in TableauPublic before we will have to think about filtering the data set down in anyway.

Owning Your Dexcom Data.

Getting your Dexcom numbers off of your device and into a format that allows you to see what’s really going on. Let’s be real… the Dexcom reporting sucks. (hence my search for alternatives)

The idea of Diasense is great. I love that I can pull in my UP24 data alongside my Dexcom and OmniPod Data, but the reports are horrendous.

Let me add a caveat to explain that I am 100% biased against bad reporting because data is what I do for work… in fact this is also what I do for fun. I understand that this is not the norm… but I also know the power of being able to access your data, not only to see the literal picture of what is happening, but also being able to drill down into the data to find insights that are not accessible by just looking at my Dexcom screen each day.

Here’s the process I’ve decided to follow — I’m going to hack the data of my individual devices (Dexcom, OmniPod, UP24), then I am going to find the best way to integrate them into a single data set and use any and all tools at my disposal to process and visualize that data. That is phase 1, phase 2 is to figure out how to do it better… did I also mention that I’m an Industrial and Systems Engineer?… Process Improvement is my jam. Looking at the process that I followed in Phase 1, I will determine how to make it a more efficient repeatable process, and what interval I will be able to feasibly update the reporting. Then, as all good process engineers would agree… I will do it again… learn from the previous process and try to make it even better.

In the meanwhile, I am also tracking the status of
as they all look like promising technologies.

I am also looking at possible integration of the following tools into my initial patchwork system.
Sugar Sync
Calorie King
Diasense

this is theoretically not all that complicated… I have numbers, I want to see them… why is this so fucking difficult…